
The Flesh and Blood 2025 World Championship in Philadelphia is now behind us. After months of testing, theorycrafting, and heated discussions, we finally got to see the world’s best players clash on the biggest stage. But as every competitive player knows: the end of Worlds doesn’t mean the end of competition.
With the community already looking ahead, this is the moment to examine which heroes stand to gain – or to suffer – in the current meta. This will be especially relevant for players, like yours truly, preparing for the Calling Valencia in just a week.
Identifying who is most likely to win does not take too much effort, nor does it bring anything that we already don’t know in this moment. This time I want to tackle a slightly more difficult data challenge: which heroes are truly meta-favored, and which ones are quietly meta-unfavored once popularity, variance, and matchup spread are accounted for.
Alternative scenarios
We will start our analysis by running a Monte Carlo simulation of 1000 world championships. We know that what we witnessed is just one of the possible outcomes of what could have been. One extra shuffle can change the outcome of a game completely, regardless of your skill. For this reason, simulating 1000 tournaments of Swiss should give us a solid distribution of single-hero success rates.
As I wrote in my first article using tournament simulation, the first ingredient that we need will be a hero vs hero win rate matrix like the one you can find on Fablazing. I calculated the same matrix using data from all CC and Competitive CC matches played over the past 20 days (44481 matches to be precise) on Talishar. I also removed from the data all games having less than 3 turns or lasting less than 5 minutes. This should get us rid from games where one player immediately quit for one reason or another, reducing the noise.
The second ingredient are the hero pick rates. Here the choice is completely up to us. As I want to prepare for Valencia, I hypothesized that the meta is unlikely to shift drastically in the short term (except for maybe a bit more Cindra hate). To determine the simulation pick rates I therefore decided to use the same exact numbers from the FaB Worlds you can see below.

Each of the 1000 simulations I ran via a Python script contain a full tournament, where the probability of hero A winning versus hero B is determined each time by their win rate. For example, if Kayo has a 40% win rate versus Gravy Bones, out of 100 matches he will win approximately 40 times. At the end of each simulated tournament I recorded which heroes made it to the Top 8 bracket. After doing it for 1000 times I calculated the % of times that each single hero made it there.
Monte Carlo Simulation Results
The result of the simulation in the plot below gives us the first look at who is most likely to reach a Top 8 given how often each hero is played and how they perform into the field.
Here are the top 15 heroes with the highest probabilities:

The 95.8% associated with Cindra means that at least 1 Cindra was in Top 8 in 958 of the 1000 simulated tournaments. This also means that there were a bit less than 50 cases where no Cindra made it to Top 8. This is very unlikely to happen but always possible, and if it happened at a real tournament people’s perception of Cindra’s power would shift dramatically.
But does the high number associated with Cindra mean that she is 6+ times stronger than, for example, Dorinthea with a 14.2%? Not at all. We have to always keep in mind that the hero with the highest chance of appearing in Top 8 (and likely to win events) is also the hero with some of the highest representation in the field.
In other words:
Cindra’s high Top 8 likelihood is not just a matter of power – it’s also a function of sheer popularity.
Higher representation alone increases the likelihood of converting into Top 8.
This is why raw Top 8 results alone can be misleading.
To truly understand favorability, we must compare the simulation to the baseline probability one would expect only from representation – before matchup edges come into play. My question to you now is: if all heroes had a 50% win rate in each match, what would the probability of each hero to make it to Top 8 look like? We’ll see the answer in the next section.
Baseline Probability of Making Top 8
To understand how likely a hero is to reach the Top 8 just because of how many players chose that hero, I calculated a baseline probability.
Here’s the idea in plain terms:
- Imagine we randomly pick 8 players from the tournament.
- We don’t look at win rates or matchups at all. Everyone is assumed to be equally strong.
- The question is simply: “How likely is it that at least one of those 8 players is on this hero?”
If a hero has a lot of players in the field, this probability will naturally be high.
If only a few people brought the hero, the probability will be low.
So this baseline tells us what Top 8 appearances we should expect purely from popularity, before factoring in actual performance. If you want to dig deeper, you can find out more about how this statistic behaves in this article here.
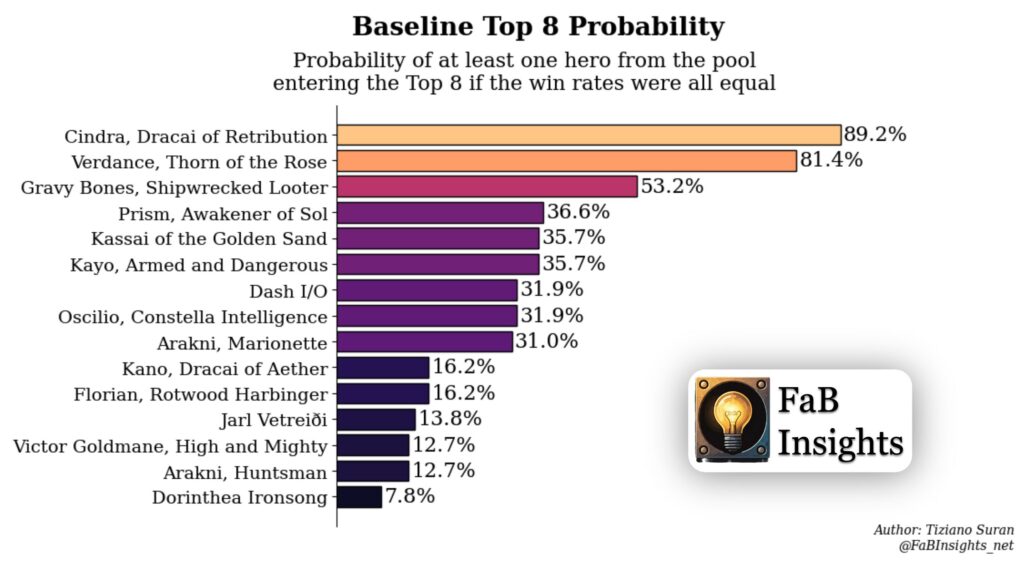
The first thing you will notice from the plot above is that Cindra’s baseline probability of making it to Top 8 was already the highest.
This allows us to correct our intuition. When a hero with massive representation shows up in Top 8, it often feels like the hero is “dominating” – but much of that is simply mathematics. I am not saying that Cindra is not strong, but our perception fo her strength is heavily distorted by her popularity.
This is why comparing expected (baseline) vs simulated (real performance) is essential. The baseline probability isolates the effect of popularity alone. When we subtract it from the Monte Carlo result, we remove the component of performance that comes purely from representation.
What remains is a measure of how the hero actually interacts with the current field. This includes both its intrinsic power (encoded in the matchup matrix) and how well its strengths align with the meta.
For this reason, the difference between the Monte Carlo result and the baseline is best interpreted as a measure of meta strength: how much a hero overperforms or underperforms once popularity is factored out.
And the plots in the following sections will show us exactly that.
Meta-Favored Heroes
After subtracting the baseline probabilities from the tournament simulation results, below you can see the heroes that exceed their baseline expectation. These are the heroes that are winning more than the simple representation math would predict. They have strong matchups into the field, efficient gameplans into popular decks, or both.
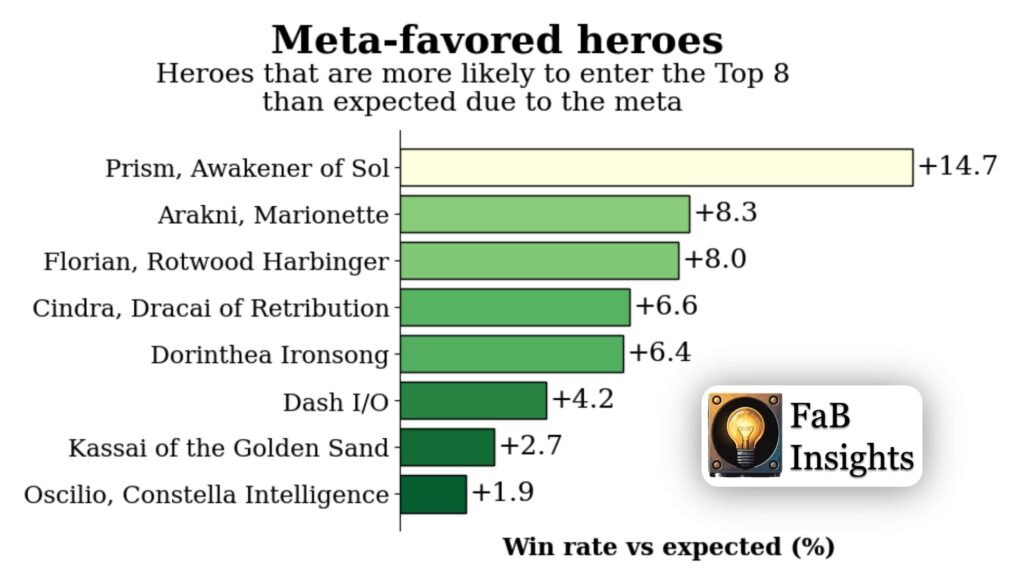
The most favored hero currently appears to be Prism, with a probabiltiy of achieving Top 8 of 14.7% points higher than her baseline. The fact that she was also the 4th most played hero at the Worlds tells us that her potential did not go unnoticed among the most competitive circles. The same world champion decided to reserve not 3 but 4 spots in the inventory for poppers to play against Prism.
Meta-Unfavored Heroes
Here we have the heroes that fall below their baseline expectations. Despite some being played in significant numbers, they convert into Top 8s less often than representation alone would suggest.
In practice, this means:
- They face unfavorable matchups into the most popular heroes
- Their gameplan may struggle in the current ecosystem
- They are likely to perform worse than players expect, unless the meta shifts

What may come as a surprise here is seeing Gravy and Verdance with such low numbers. However, if you consider the fact that their matchup vs Cindra is not the most favored, paired with the fact that 86 players brought Cindra, this makes it more difficult for the Necromancer and Earth Wizard to fight their way to the Top 8. We have also seen a decent representation of Prism, also an unfavored matchup. Should the number of Prisms rise – as our data would suggest – both Verdance and Gravy will struggle even more.
Conclusions and Takeaways
What this analysis shows is that raw Top 8 results give us a distorted view of hero strength. Tournament standings only tell us who survived on a given weekend, in an environment where chance, pairings, and representation all play a significant role.
By combining representation data, baseline probabilities, and a full Monte Carlo simulation, we can correct for the single biggest bias in competitive Flesh and Blood: popularity masquerading as power.
This approach reveals how some heroes appear dominant simply because half the field is playing them, while others quietly overperform once we remove the noise of representation.
Heroes that show strong positive deviations are the ones structurally advantaged in the current ecosystem. And as we move toward The Calling: Valencia, these meta-favored heroes are the ones most likely to convert – assuming the meta does not undergo a major shift.
Of course, every rise in an anti-meta deck creates the conditions for a new meta to form, which in turn invites its own counters. The players who gain the most are those able to anticipate these shifts and identify which hero will benefit before the rest of the field adapts.
And that constant cycle of adaptation is exactly the beauty of competitive Flesh and Blood.
A personal note
This method is something I’ve poured a lot of time, curiosity, and passion into. It is an attempt to make sense of the hidden patterns beneath the chaos of competition. While it’s still evolving, it has already helped me (and hopefully you) see the meta with a level of clarity that simple results can’t offer. And I’m excited to keep improving it as new data and new metas emerge.
Thanks for reading, and for caring about the game deeply enough to explore the numbers behind it.
Good luck with your testing, and may this give you the confidence to choose the hero that truly fits the moment.
Cheers,
Tiziano